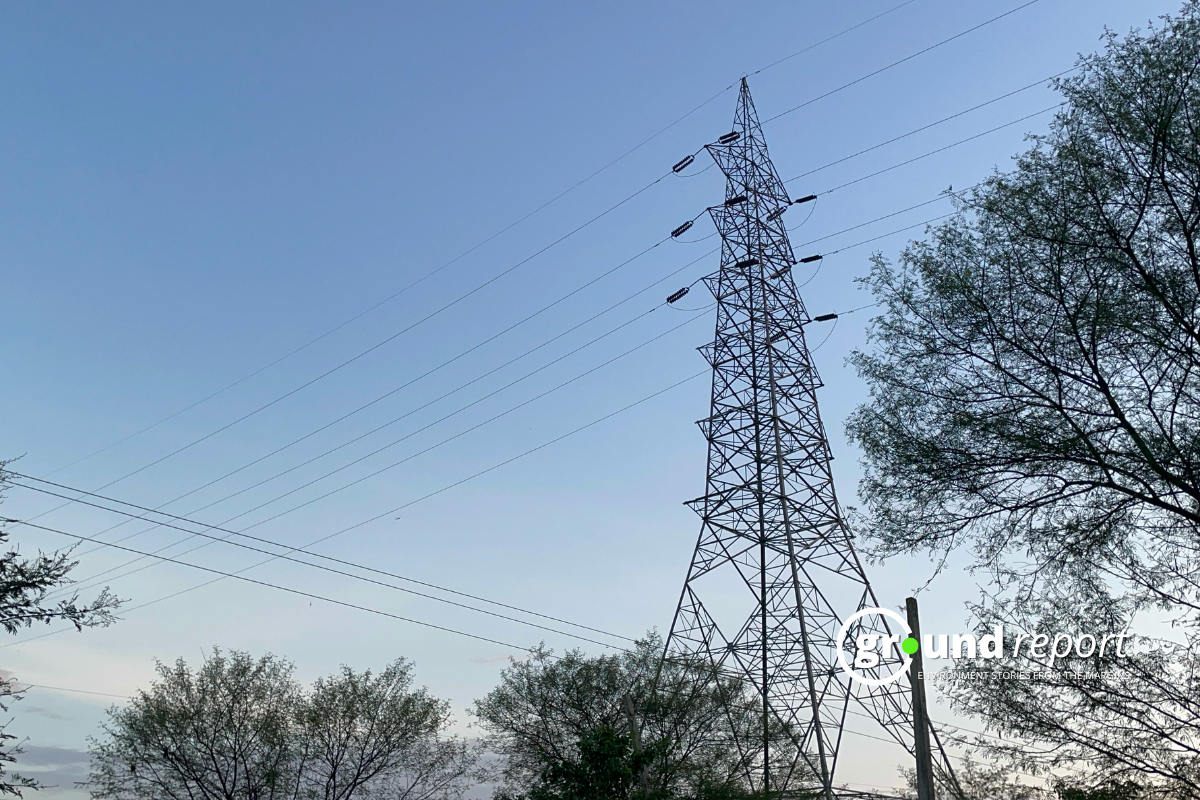
Electricity generation in India was mainly dominated by thermal power plants, which use fossil fuels such as coal, oil and gas to generate electricity.
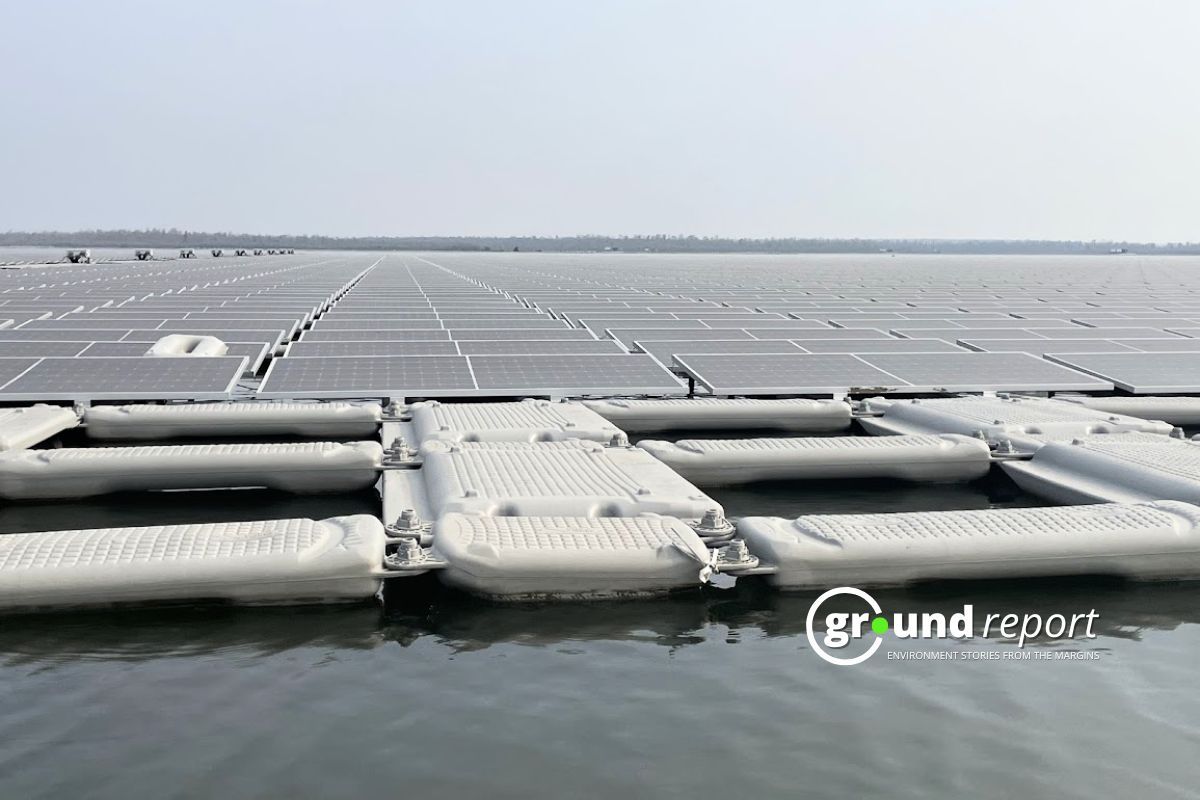
Renewable energy sources such as solar, wind, hydroelectric, and biomass power plants accounted for a smaller but growing share of India’s electricity generation mix. India also has a limited number of nuclear power plants, which contribute a small part of the total electricity generation.
India has been working to diversify its electricity generation mix and increase its share of renewables in recent years. The government has set ambitious targets for renewable energy capacity and has implemented various policies and programs to promote the development of renewable energy projects.
Some of these initiatives include the establishment of a National Solar Mission, which aims to increase solar power capacity in India, and a Wind Power Mission, which seeks to promote the development of wind power projects.
In 2021, the total installed electricity generation capacity in India was around 383 GW. The participation of the different sources in the total installed capacity was as follows:
Thermal Energy: Thermal power plants concentrated most of the installed capacity, around 63%. These power plants use fossil fuels such as coal, oil, and gas to generate electricity.
Renewable Energies: The participation of renewable energies in the installed capacity was around 38%. This includes various sources such as solar, wind, hydro and biomass power plants.
Nuclear power: Nuclear power plants accounted for a very small share, around 2%.
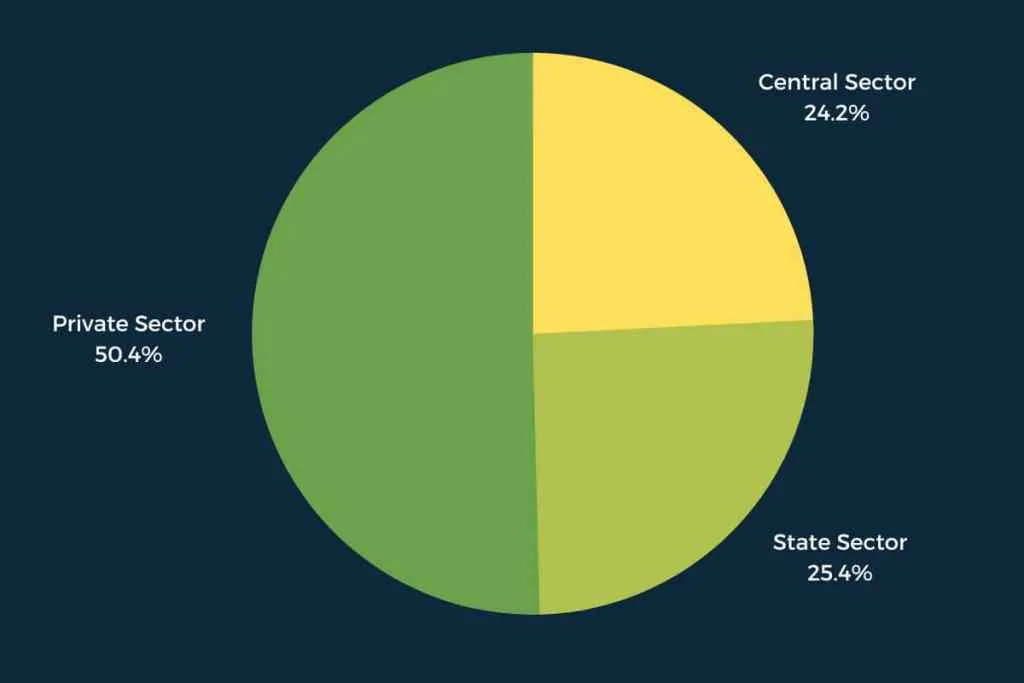
Installed generation capacity (sector-wise)
| Sector | MW | % of Total |
|---|---|---|
| Central Sector | 99,455 | 24.2% |
| State Sector | 1,04,922 | 25.4% |
| Private Sector | 2,07,272 | 50.4% |
| Total | 4,11,649 |
It is worth noting that India has set an ambitious target of achieving 450 GW of renewable energy capacity by 2030, which would significantly increase the share of renewable energy in the electricity generation mix.
The government has also been taking various measures to promote renewable energy, such as offering incentives for the installation of rooftop solar panels and encouraging the development of offshore wind power.
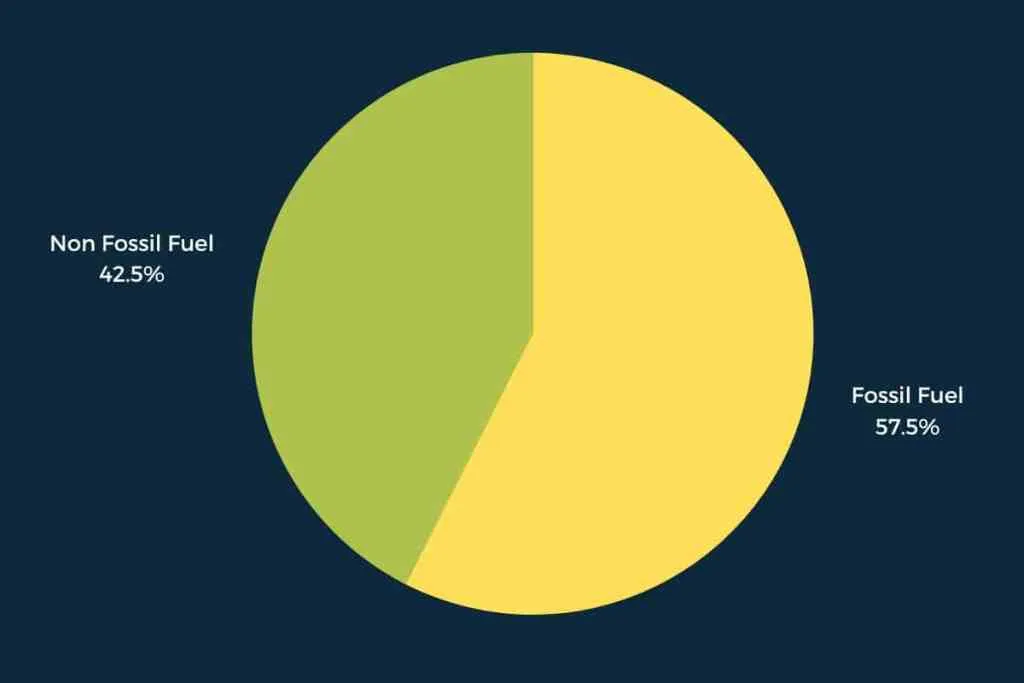
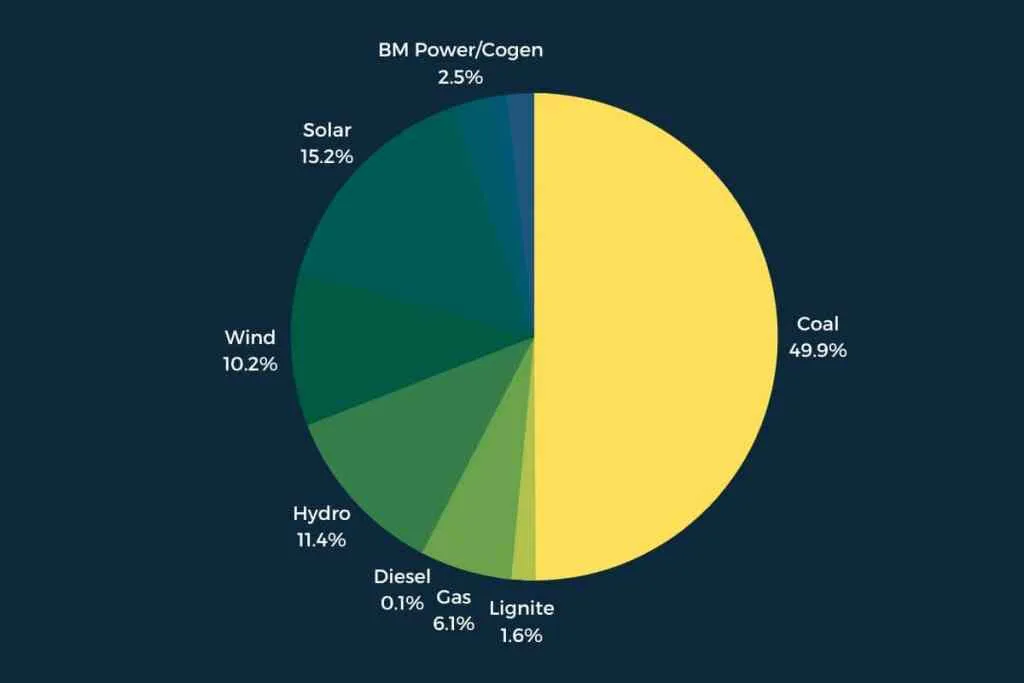
Installed generation capacity (fuel-wise)
| Category | Installed generation capacity(mw) | % of share in total |
|---|---|---|
| Fossil Fuel | ||
| Coal | 204,435 | 49.7% |
| Lignite | 6,620 | 1.6% |
| Gas | 24,824 | 6.1% |
| Diesel | 589 | 0.1% |
| Total Fossil Fuel | 2,36,469 | 57.4 % |
| Non-Fossil Fuel | ||
| RES (Incl. Hydro) | 168,400 | 40.9% |
| Hydro | 46,850 | 11.4 % |
| Wind, Solar & Other RE | 121,550 | 29.5 % |
| Wind | 41,983 | 10.2 % |
| Solar | 63,894 | 15.1 % |
| BM Power/Cogen | 10,210 | 2.5 % |
| Waste to Energy | 523 | 0.1 % |
| Small Hydro Power | 4,940 | 1.2 % |
| Nuclear | 6,780 | 1.6% |
| Total Non-Fossil Fuel | 175,180 | 42.5% |
| Total Installed Capacity(Fossil Fuel & Non-Fossil Fuel) | 4,11,649 | 100% |
Support us to keep independent environmental journalism alive in India.
Keep Reading
What is Green Hydrogen? Could it change energy in South Asia?
Blue hydrogen is worst for climate: study
How Increasing space traffic threatens ozone layer?
Hydro Fuel Market: India’s current scenario and the future ahead
Natural Gas is a Misleading term, It is not Natural and clean at all
Follow Ground Report on X, Instagram and Facebook for environmental and underreported stories from the margins. Give us feedback on our email id greport2018@gmail.com.
Don’t forget to Subscribe to our weekly newsletter, Join our community on WhatsApp, and Follow our YouTube Channel for video stories.