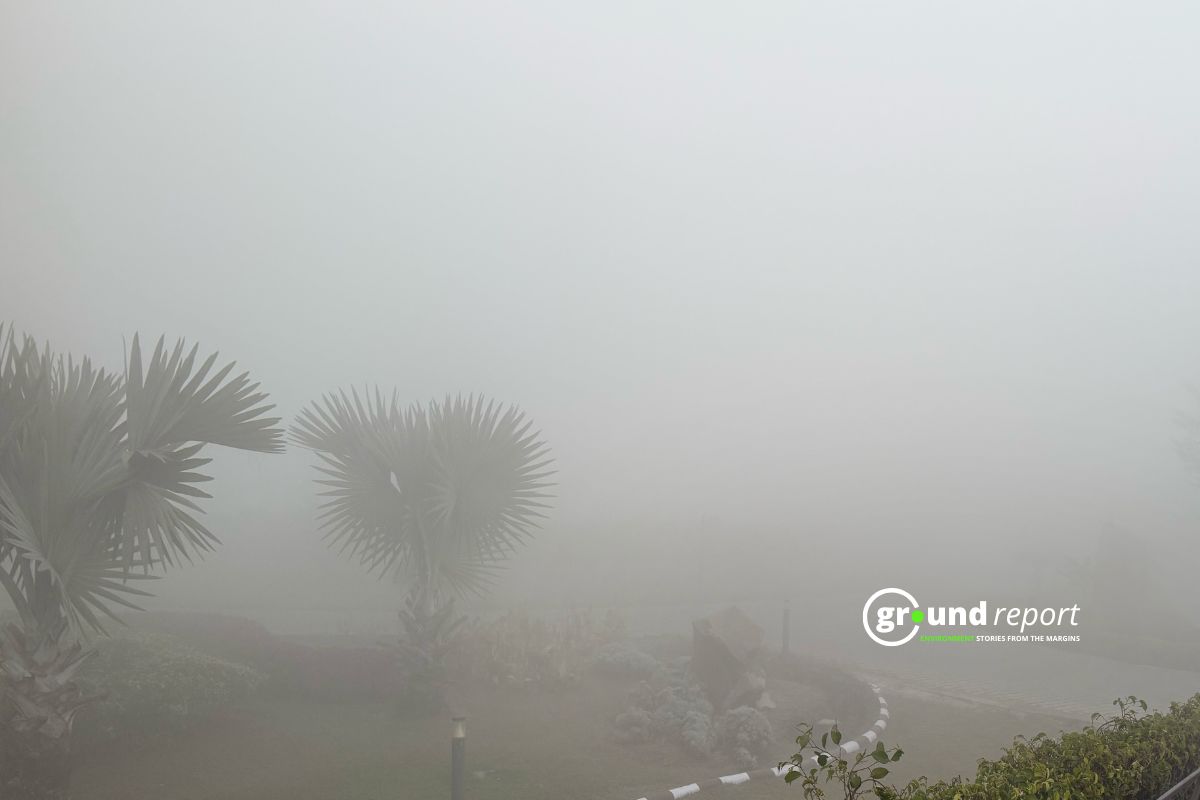
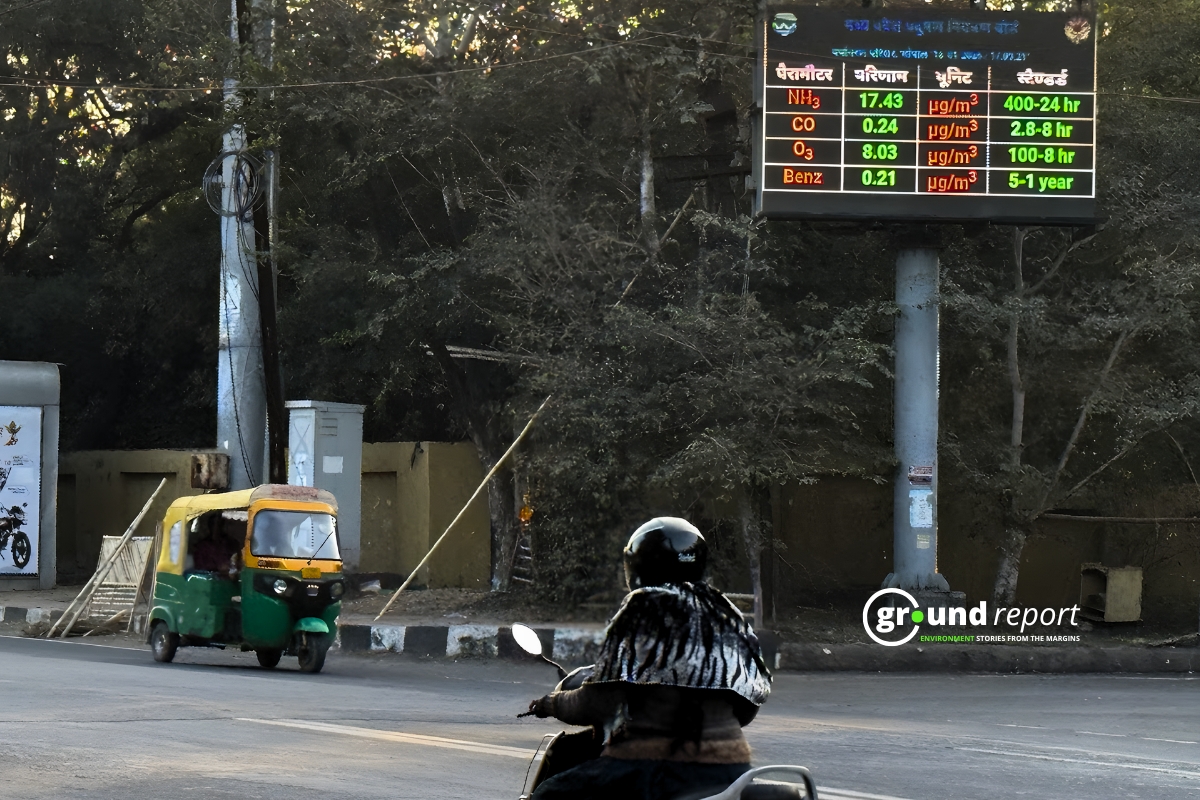
Delhi’s air pollution recently hit alarming levels, with the Central Pollution Control Board (CPCB) recording an average Air Quality Index (AQI) of 494, just shy of the maximum 500 on India’s AQI scale. While this threshold may seem absolute, actual air quality measurements can exceed this figure. Independent platforms, like IQAir, have reported AQI readings above 1,500 in certain locations during peak pollution seasons in October and November.
Delhi’s AQI reached alarming levels, exceeding expectations
India’s Air Quality Index (AQI) is capped at 500, with any readings above this level falling into the “severe plus” category, signalling a public health emergency. As Dipankar Saha, former head of the CPCB’s Air Laboratory Division, explained to The Times of India, “Values from 451 to 500 are already in the ’severe plus’ category, which triggers the strictest anti-pollution measures.”
In contrast, international systems like IQAir have no upper limit, allowing AQI values to exceed 500, often creating confusion but highlighting the seriousness of pollution levels.
The discrepancy between the two systems arises from differences in measurement techniques. India uses analyser-based systems, regarded as more accurate by experts. Meanwhile, IQAir uses sensor-based systems, which, while useful, can lack precision. Saha noted, “Analyser-based AQI is more accurate. IQAir’s calculation methods are unclear.”
IQAir’s Air Quality Index follows the U.S. model developed by the Environmental Protection Agency (EPA). The scale has six levels, from “good” to “hazardous.” While both the U.S. and Indian AQI scales range from 0 to 500, the U.S. scale doesn’t have an upper limit. Any AQI value above 301 is “hazardous,” allowing values over 500 to be reported.
The Indian and US scales use different formulae for calculating the AQI, resulting in different data for the same pollutants. On Monday, the Indian AQI was around 490; while IQAir’s index exceeded 1,000. Despite the difference, both readings indicated extremely hazardous air quality.
AQI differences arise from varied methods
Experts assert that capping the AQI at 500 is based on the understanding of health impacts from air pollution. Mortality and morbidity rates associated with air quality degrade significantly after this threshold. Essentially, capping the AQI simplifies public health messaging: values beyond 500 won’t alter responses. Such an approach aims to simplify air quality communication, ensuring individuals understand when action is needed.
However, this practice overlooks air quality monitoring nuances. Gufran Beig from the System of Air Quality and Weather Forecasting and Research (SAFAR) highlighted that while the CPCB’s approach is based on Indian standards, international platforms use stricter guidelines, reflecting worse air quality.
The CPCB considers PM2.5 levels of 60 micrograms per cubic meter to be an AQI of 100, while the World Health Organization (WHO) sets the level at 50 micrograms per cubic meter. This difference illustrates the divergence in air quality assessment methods, leading to different AQI readings.
Another significant factor contributing to the confusion over AQI figures is the varied methodologies employed by different monitoring platforms. The CPCB predominantly uses government-owned monitoring stations and computes AQI based on 24-hour averages. In contrast, independent platforms like IQAir utilize real-time sensor-based monitoring, which may capture rapid air quality changes but can also be more error-prone.
Discrepancies are exacerbated by basic glitches in CPCB’s reporting software, which can underreport severe pollution levels. Beig pointed out that while the CPCB aims to provide a clearer representation of air quality based on a systematic approach, the issue is that when pollutants exceed the current system’s reporting capability, an inherent challenge arises.
AQI discrepancies arise from measurement differences
The Air Quality Index (AQI) is crucial for assessing air pollution levels. In India, the Central Pollution Control Board (CPCB) caps AQI readings at 500, indicating “severe” pollution, prompting residents to stay indoors and limit physical activity.
However, international platforms often report AQI values exceeding 1,000 for the same locations, which can confuse the public. These discrepancies arise from differences in pollutant measurement methods, data sources, and computational models.
The CPCB relies on government-owned monitoring stations, while international platforms may include satellite imagery, private sensors, and predictive models. Differences in pollutant metrics, such as PM2.5, PM10, carbon monoxide, sulfur dioxide, and ground-level ozone, and varying weightings also contribute to the disparity.
AQI vs Concentration: Which Is More Reliable? The complexity of AQI metrics often leads to confusion, especially when comparing international standards. The acceptable daily concentration for PM2.5 in the U.S. is 15 µg/m³, while in India, it is 60 µg/m³. For PM10, the U.S. standard is 45 µg/m³, while India’s limit is 100 µg/m³.
Support us to keep independent environmental journalism alive in India.
Keep Reading
Watch: Kashmir experiences first snowfall of season after dry spell
Amarnath Yatra: Tackling rising death toll from extreme weather events
Tourists arrival in Kashmir break records, a need to regulate it?
From tourist paradise to waste wasteland: Sindh River Cry for help
Follow Ground Report on X, Instagram and Facebook for environmental and underreported stories from the margins. Give us feedback on our email id greport2018@gmail.com.
Don’t forget to Subscribe to our weekly newsletter, Join our community on WhatsApp, and Follow our YouTube Channel for video stories.


