In March 2024, the Space Application Center published a high-resolution remote sensing assessment and analysis of Indian wetlands. The publication (hereinafter 2024 Atlas) has been prepared under Phase 2 of the National Wetlands Inventory and Assessment programme of the Department of Space, Government of India and led by the Space Application Center (SAC) of the Indian Space Research Organization in collaboration with 30 partners, most being state remote sensing application centres.
The 2024 Atlas is a geo-spatial database of Indian wetlands at 1: 12,500 scale using a 20-wetland type classification. Pre and post-monsoon images of 2018 and 2019 from the high-resolution LISS-IV sensor on the Resourcesat-2/2A satellite have been used to assess the extent of the wetlands. An unspecified number of wetlands have also been ground-truthed to enhance the image interpretation and analysis accuracy.
The total wetland area in India has been estimated to be 16.89 Million hectares, equaling 5.12 percent of the country’s total geographic area. A total of 2.49 million wetlands (area >= 0.1 ha, total area 16.84 Mha) and 1.09 million wetlands having (area < 0.1 ha, total area 0.05 Mha) have been mapped. The atlas also provides wetland number and extent data for different types of wetlands within states (in individual districts), river basins and biogeographic zones. The SAC website also provides a visualisation tool for the inventory data of 2006-7, 2017-18 and 2019.
The 2024 Atlas is a refinement of Atlas published by SAC in 2022 wherein wetlands of area greater than 2.25 ha were mapped at 1:50,000 scale using images of 2017-18 from LISS III sensor (hereinafter 2022 Atlas). The LISS IV sensor has a resolution of 5.8 m as compared with 23.5 m of LISS III. Thus, the 2024 Atlas has a minimum mapping area of 0.1 ha against 2.25 ha of 2022 Atlas.
So, how many wetlands does India have, and what has been lost?
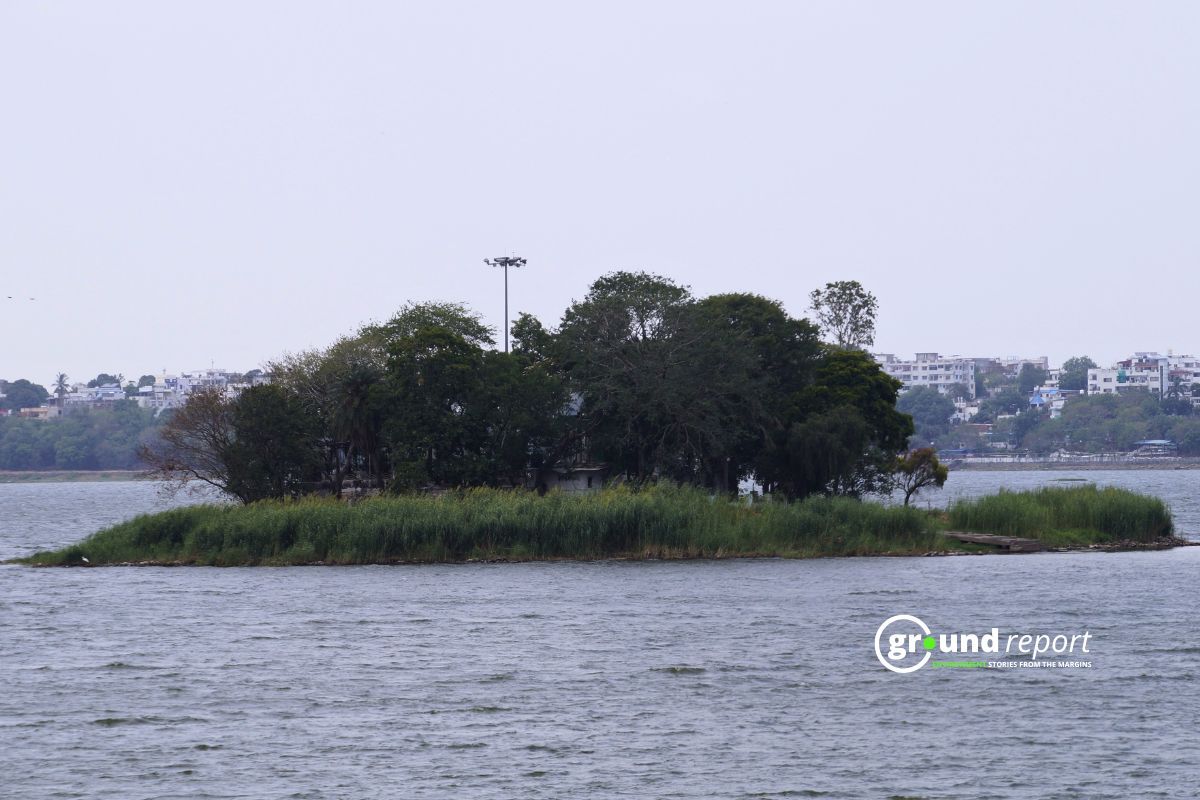
India is blessed with an enormous diversity of wetlands ranging from the high-altitude lakes, marshes and peatlands of the Himalayas and Trans-Himalayas, marshes and swamps in the Terai, floodplains and ox-bows in the Gangetic-Brahmaputra alluvial plains, saline flats in the Great Indian Desert, tanks and reservoirs in the Deccan region, and estuaries, mudflats, mangrove marshes and coral reef areas interspersed along our coastline. Efforts to collate national statistics on the extent of wetlands in the country have been made over time and have evolved progressively with improvements in cartographic technologies and capacities.
The 2024 Atlas is the fifth in the series which applies earth observation to assess the extent of the wetland in the country. The first remote sensing-based inventory of wetlands was published in 1998, using post-monsoon and pre-monsoon data from IRS 1A/1B LISS-I/II data. The major states were inventoried at 1:250,000 scale, whereas the North-Eastern states were mapped at 1:50,000 scale. The inventory yielded a national wetland extent of 12.87 million hectares, of which 8.8 million hectares were inland and the rest coastal.

The second wetland inventory, done in 2004-2005 at 1:250,000 scale using 2004-05 Resourcesat AwiFS images (spatial resolution 58 m), yielded an estimate of 8.83 million hectares. In 2007, the third cycle of national wetland inventory was prepared at a consistent 1:50,000 scale, derived from the analysis of RESOURCESAT I LISS III data of 2006 – 07. The extent of wetlands in the country was assessed to be 14.70 million hectares. In 2022, the Government of India released the ‘National Decadal Wetlands Change Atlas’, providing data on wetland number and extent in 2017-18 and an assessment of change since 2006-7. The Atlas maps 0.23 million wetlands (having an area equal to or greater than 2.25 hectares) spanning 15.98 million hectares (4.86 per cent of the country’s geographical area).
The previous atlases did not present an estimate of small wetlands, or wetlands below the mapping threshold. The 2011 Atlas, which was based on LISS III data of 2007-08, was the first to include an estimate of wetlands under the minimum mapping threshold of 2.25 ha. The atlas indicated that the country had 0.55 million wetlands of area less than 2.25 ha. However, the first census of water bodies published by the Ministry of Jal Shakti in 2023 (using data from 2018-19) enumerated 2.42 million waterbodies, with 72% having waterspread of less than 0.5 ha. The 2024 Atlas seems to have bridged this anomaly by reporting that the country has 3.23 million wetlands with an area less than 2 ha.
With each inventory, the total extent of wetlands in the country has been reported to have increased. Unfortunately, as most atlases use a different scale and data resolution, the estimates are not comparable (barring the 2022 Atlas, which presents a comparison between the wetlands extent reported in 2006-7 and 2017-18. The 2022 Atlas indicated that the number and extent of wetlands having areas equal to or greater than 2.25 ha increased during the 2006/7-2017/18.
The natural coastal wetlands declined on an overall (from 3.69 million hectares to 3.62 million hectares in ten years). While the area has been reported for mangroves (by 18,662 ha), creeks (26,929 ha), and coral reefs (2,784 ha) increased; the inter-tidal mudflats have receded by a whooping 116,897 ha, and so did salt marshes (by 5,647 ha). The natural inland wetlands have remained mainly stable, marginally increasing (from 42,157 to 42,779 in numbers and from 6.93 million ha to 7.02 million ha in area during 2006/7-2017/18).
The decadal change atlas provides only a snapshot of recent trends in wetlands extent. The increase in natural inland wetlands calls for close introspection. Wetlands are formed in topographic depressions and shaped over a long period by complex geological and hydrological processes. In the trans-Himalayan and Himalayan regions, the formation of new wetlands has been reported for quite some time, primarily linked with deglaciation. However, in other regions, the formation of new natural inland wetlands needs scrutiny. In a short timeframe of a decade, as the report refers to, wetland formation is more likely to be attributed to human-induced landscape alteration. The increase in wetland number may also be indicative of increased fragmentation.
It is thus hard to track how much wetlands has the country lost over time. A compilation of land records for 1880-1980 for most of the mainland area (excluding the Islands) placed the total wetlands in the country in 1880 to be 6.35 million hectares and surface waters an additional 8.65 million hectares. The area under wetland progressively declined to 4.06 million hectares, in 1980 with the most significant decline being in forested wetlands. The area under surface waters increased marginally to 8.683 million hectares during 1880-1980. Overall, wetlands in the country declined from 4.69% (of the total area assessed) in 1880 to 3.98% in 1980.
A global study published in Nature in 2023 with a longer-term reconstruction of natural wetland change suggests that India may have had 61.3 million hectares of natural wetlands in 1700, which nearly halved to 37.2 million hectares by 2020. India has been indicated as the top three countries (after United States and China) in terms of wetlands loss during 1700 – 2020.
India is a land of small wetlands. As per 2024 Atlas, wetlands less than 0.1 ha form 90% of the total wetlands. However, none of the change studies capture the dynamics in the extent of these ecosystems.
How confident are we about the current inventory?
The 2024 Atlas and 2022 Atlas are based on remote sensing images of only a years’ difference, with the former using higher resolution data as compared with the latter.
However, surprisingly and counter-intuitively, in the 2024 atlas, a reduced wetland area has been reported for several categories. In the inland wetlands category, a reduced area has been reported for lakes (37%), riverine wetlands (34%), nature waterlogged (21%), human-made waterlogged (44%), salt pans (33%), oxbows (4%) and high altitude wetlands (2%). Similarly, in the coastal wetlands category, a reduced area has been reported for sand/beach (25%), lagoon (6%), intertidal wetlands (35), saltpans (13%) and coral reefs (2%). The change in resolution in the two atlases has also produced a dramatic increase in the number of wetlands, with nearly 14 times increase reported in tanks and ponds, six times increase in rivers/streams, four times increase in coastal aquaculture and three times increase in creeks.
The 2024 Atlas and its three iterations present wetlands extent and numbers using a 20-fold wetlands classification. The classification has been modified from Ramsar typology (which indicates 42 different types). This typology was developed mainly to enable the designation of Wetlands of International Importance, yet, does not render easily to national inventories as it is not systematic (as a mix of biological, physical, chemical and other criteria are used without a unifying classification scheme).
The 2024 Atlas uses a three-level classification. At the first level, the classification system places wetlands in either of the two categories (inland and coastal), and at the next, each wetland is assigned to the natural or man-made category. At the third level, the wetlands are placed in either of the 20 categories (13 natural and seven man-made).

The first level classification into inland and coastal wetlands seems to have been done in terms of geographical location. This may be limiting as the term coastal wetlands are generally used to refer to wetlands influenced by oceans and related coastal processes and may be located landwards of the coastline. The second level classification into natural and human wetlands also needs careful introspection, as over time, even human-made wetlands develop into naturalized ecosystems, providing habitats to species and important ecosystem services in the landscape.
The third level classification is a hodge-podge (at times, vegetation is used, and for others, inundation and elevation for high-altitude wetlands). A separate waterlogged category is used, wherein most wetlands could eventually be placed. Similarly, the class High altitude wetlands may also include other wetland classes such as lakes. It is highly likely that the differences in wetland areas and numbers between 2024 Atlas and 2022 Atlas are due to inconsistent classification.
Several wetland types, such as peatlands, seagrass meadows, and karst wetlands, do not find coverage in these atlases. The seamless vegetation map of India for 1992-2012, published by ISRO in collaboration with several institutions, provides details on forested swamps and marshes which are otherwise missing in the national atlas. The extent of wetlands represented by the atlas may, therefore, at best, serve as the lower limit of wetland extent in the country.
Can wetland atlases be prepared using remote sensing alone?
Mapping wetlands using remote sensing techniques is a complex and arduous task. The term wetlands groups a range of aquatic ecosystems which are not unified by a common land cover feature (for example, vegetation in forests). While the presence of water is a distinguishing feature, water may be present seasonally or permanently and at the surface or below the surface with a range of variations during the year and between the years, not all of which can be discerned through remote sensing images. Steep environmental gradients in and around the edges of the wetlands, such as boundaries between wetland vegetation and terrestrial vegetation, are challenging to resolve only using remote sensors. Finally, the highly dynamic nature of wetlands significantly alters their reflectance and energy backscatter properties.
The wetland atlases produced to date use optical remote sensing, which primarily uses sensors mounted on satellites to measure how light reflects off the earth surface. The optical remote sensing data are produced based on the reflectance of various objects, captured in terms of wavelengths, on an electromagnetic spectrum. Images generated from optical remote sensing have good resolution, are relatively easy to process, and have a rich freely available archive which can be used to assess trends in wetlands.
A range of indices are used to combine wavelength ranges (also called bands) to extract wetland signatures (inundation, hydric soils and presence of hydrophytic vegetation). Most of the thresholds used in these indices need an element of human judgement, and thus, ground truthing of representative points is required in order to resolve interpretation errors. But for a large country like ours, producing high-accuracy maps becomes a tedious task and needs to be supported, at the very least, by remote sensing and GIS teams working in tandem with wetland ecologists. Variations in the wetland extent capture determined by the analysis of satellite data and the ground condition are thereby not uncommon.
Optical images alone may not be sufficient to map the total wetland extent in its full diversity. For mangroves and forested wetlands (such as Myristica swamps), augmenting optical data with shortwave infrared channels has provided good discrimination from adjoining natural forests and plantations. Peatlands, which are incredible carbon pools, have failed to figure in any wetland assessment thus far, despite their presence being recorded in the high-altitude Himalayas and coastal regions.
Radar satellite observations, which allow penetration below the canopy, have been globally found useful for mapping these wetlands. Similarly, unique coastal wetlands such as seagrasses can be mapped using hyperspectral aerial photographs, which can not only assist in distinguishing these wetlands but also compute features such as species composition, percentage cover density and leaf area index. Segregating perennial from non-perennial wetlands effectively may best be done with a mix of optical and synthetic aperture radar data.
Multiple approaches for establishing wetland boundary exist in India, and not all of these follow the presence of wetland indicators. The boundary of East Kolkata Wetlands, an assemblage of sewage-fed fish farms on the eastern fringes of Kolkata City, includes a large chunk of agricultural lands, which collectively assist in treating wastewater, the primary ecosystem function of these wetlands. In Vembanad-Kol, an estuary-floodplain agriculture complex in Kerala is defined based on connected hydrological regimes, delineating which requires an understanding of natural and modified hydrology. Such cases call for coupling remote sensing data with extensive ground truthing and incorporating information from multiple sources.
What is the need of the hour?
For wetlands inventory to support effective programming and policy-making, the least information that needs to be captured is the status and trends in wetlands extent as well as their condition.
The United States, for example, conducts a wetlands condition assessment which is published very five years. The assessment is designed to answer questions about the extent to which our nation’s wetlands support healthy ecological conditions and the prevalence of key stressors at the national and regional scale. The assessment complements the United States Fish and Wildlife Service Wetland Status and Trends Program, which characterizes changes in wetland acreage across the conterminous United States. The two assessments provide policymakers with comparable, scientifically defensible information documenting the current status and trends in both wetland area and ecological condition.
Foundational to the national wetlands inventory is an accepted wetlands classification system, which is representative of the diversity of wetlands and addresses the various policy and programmatic needs. Classification systems based on ecosystem structure attributes (such as hydrology or plant communities) do not readily lend themselves to attribution of ecosystem functions (such as their ability to moderate floods and droughts), which are more relevant for the use of inventory information by different sectors.

Countries like the United States, Brazil and South Africa have therefore included classification systems that can also address ecosystem functions by bringing in attributes such as the direction of water flow and relative position in a basin. This is also important as the goal of mainstreaming wetlands in sectoral planning requires a description of ways in which wetlands can address sectoral challenges such as flood and drought mitigation and pollution abatement.
The inventory has to be tailored to the needs of various stakeholders, particularly wetlands managers and state wetlands authorities, who are entrusted with ground implementation of various programmes. Wetlands atlases currently provide information on wetlands extent and in some cycles, minimum and maximum inundation variability, transparency and chlorophyll. These are insufficient to produce a target setting or identify priority areas. The possibility of overlaying wetlands data with other datasets, such as land use and land cover, drainage basins, population density, linear infrastructure and others, would improve the usability of these maps for management applications.
The mapping of wetlands can be significantly improved by combining optical and radar imageries. Application of advanced technologies such as LiDAR (Light Detection and Ranging) and InSAR (Interferometric Synthetic Aperture Radar) can help improve mapping accuracy. The InSAR can detect water level changes, whereas LiDAR provides elevation data that can provide better insights into the physical features and hydrological regimes that govern wetlands. However, a robust ground truthing of the maps and data is a must.
Wetlands inventory should take an interdisciplinary approach – and involve, at the very least, ecologists and wetlands practitioners alongwith GIS and remote sensing specialists. It is essential to factor in the needs and perspectives of the state wetland authorities and field managers regarding the kind of data that is needed to support wetland conservation actions.
India can also play a strategic role in handholding national wetland inventories in other countries in the South Asia region. The experiences of designing and implementing the national wetlands inventory programme would be valuable for other Ramsar Convention contracting parties attempting to set up similar programmes.
Dr Ritesh Kumar is the Director of Wetlands International South Asia. Views expressed are personal.
Support us to keep independent environmental journalism alive in India.
Keep Reading
California Fires Live updates: destructive wildfires in history
Hollywood Hills burning video is fake and AI generated
Devastating wildfire in California: wind, dry conditions to blame?
Los Angeles Cracks Under Water Pressure
From tourist paradise to waste wasteland: Sindh River Cry for help
Follow Ground Report on X, Instagram and Facebook for environmental and underreported stories from the margins. Give us feedback on our email id greport2018@gmail.com.
Don’t forget to Subscribe to our weekly newsletter, Join our community on WhatsApp, and Follow our YouTube Channel for video stories.