A pioneering study of the daily level of fine particulate matter in the environment (PM2.5) around the world found that almost no place on Earth is safe from air pollution.
According to the first global study on air pollution, only 0.18% of the earth’s surface and 0.001% of the world’s population lives at levels of pollution considered safe.
The research, carried out by Monash University (Australia) and published in the journal ‘The Lancet Planetary Health‘, indicates that while daily levels have decreased in Europe and North America in the two decades up to 2019, they have increased in South Asia, Australia, New Zealand, Latin America and the Caribbean, with more than 70% of days worldwide with levels above what is safe.
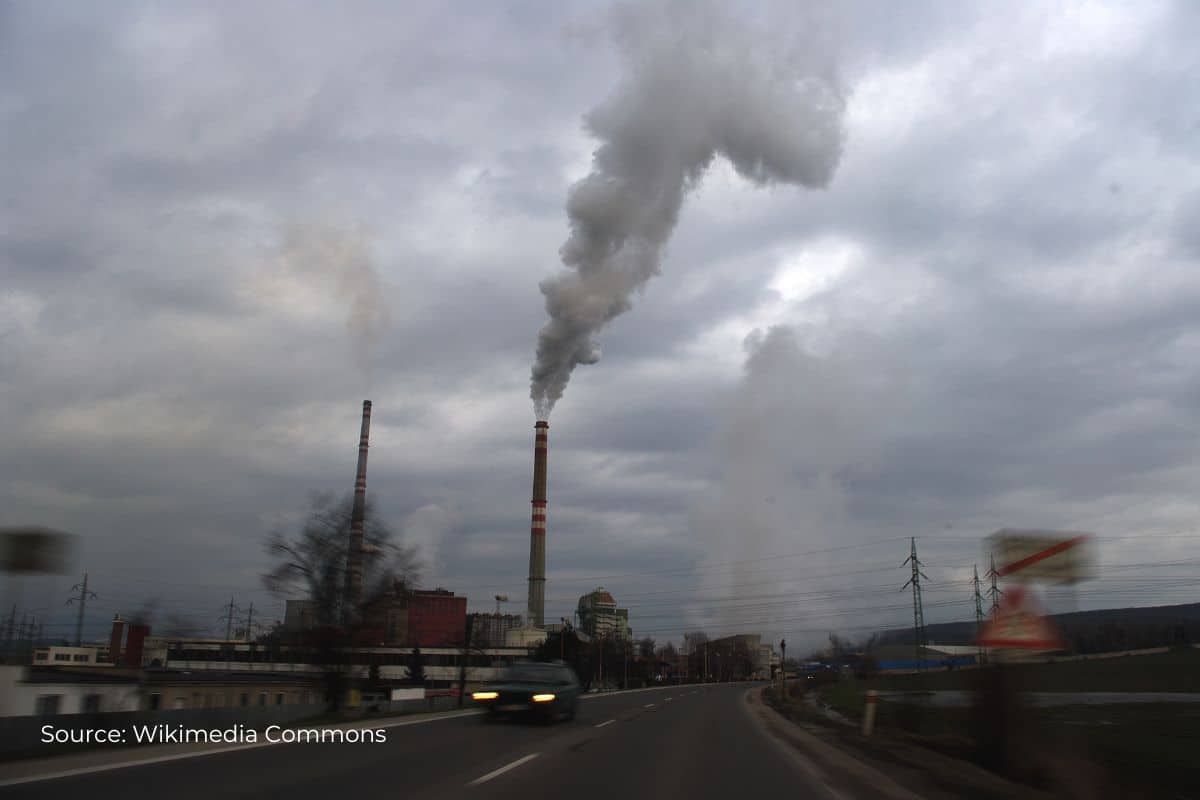
Air pollution is caused by various factors, including industrial activities, transportation, burning of fossil fuels, and natural phenomena such as dust storms and wildfires.
These sources of pollution emit harmful substances such as particulate matter, nitrogen oxides, sulfur dioxide, carbon monoxide, and ozone, which can have significant negative impacts on human health and the environment.
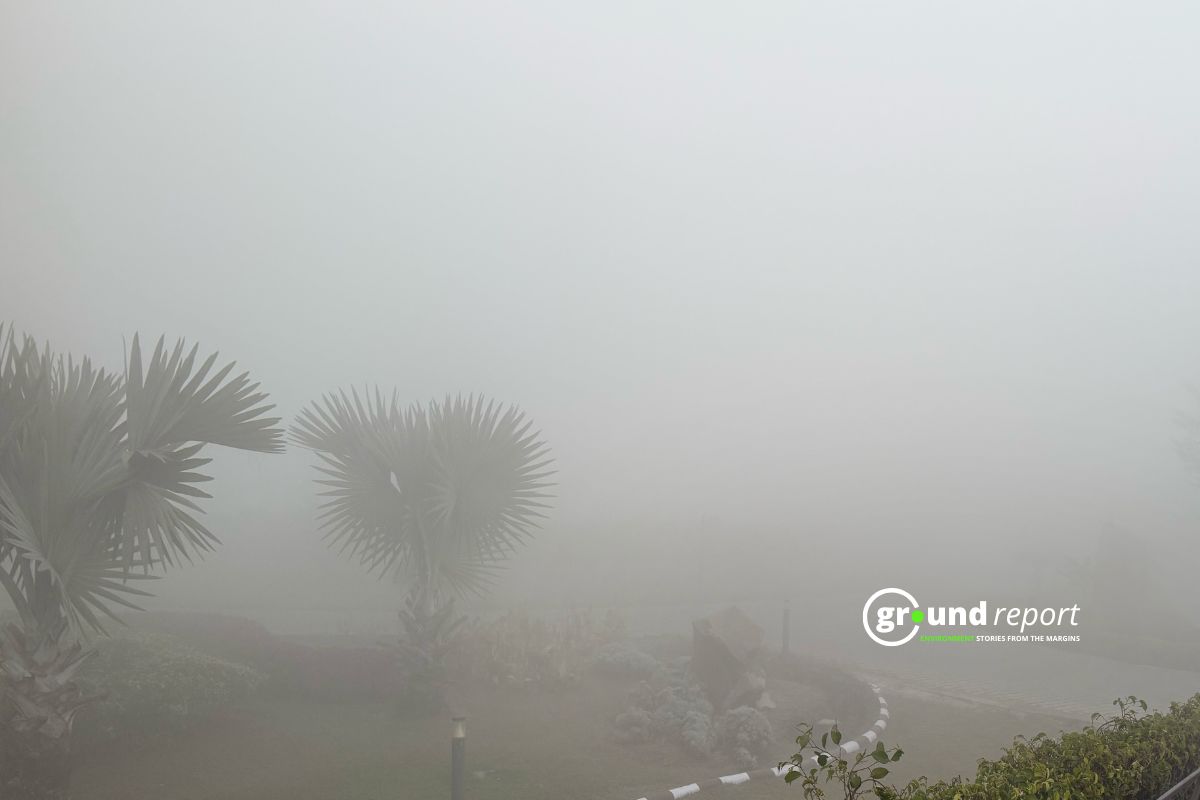
While some areas may have lower levels of pollution than others due to factors such as geography, weather patterns, and regulations, no place on earth is entirely free from air pollution.
Even remote areas such as the Arctic and Antarctic regions have been found to contain pollutants that have travelled long distances through the atmosphere.
Pollution a danger
The study -the first to measure PM2.5 pollution particles in the world- reveals that, in the last 20 years, Europe and North America have reduced their levels of air pollution while Asia, Australia, New Zealand, Latin America and the Caribbean have increased them.
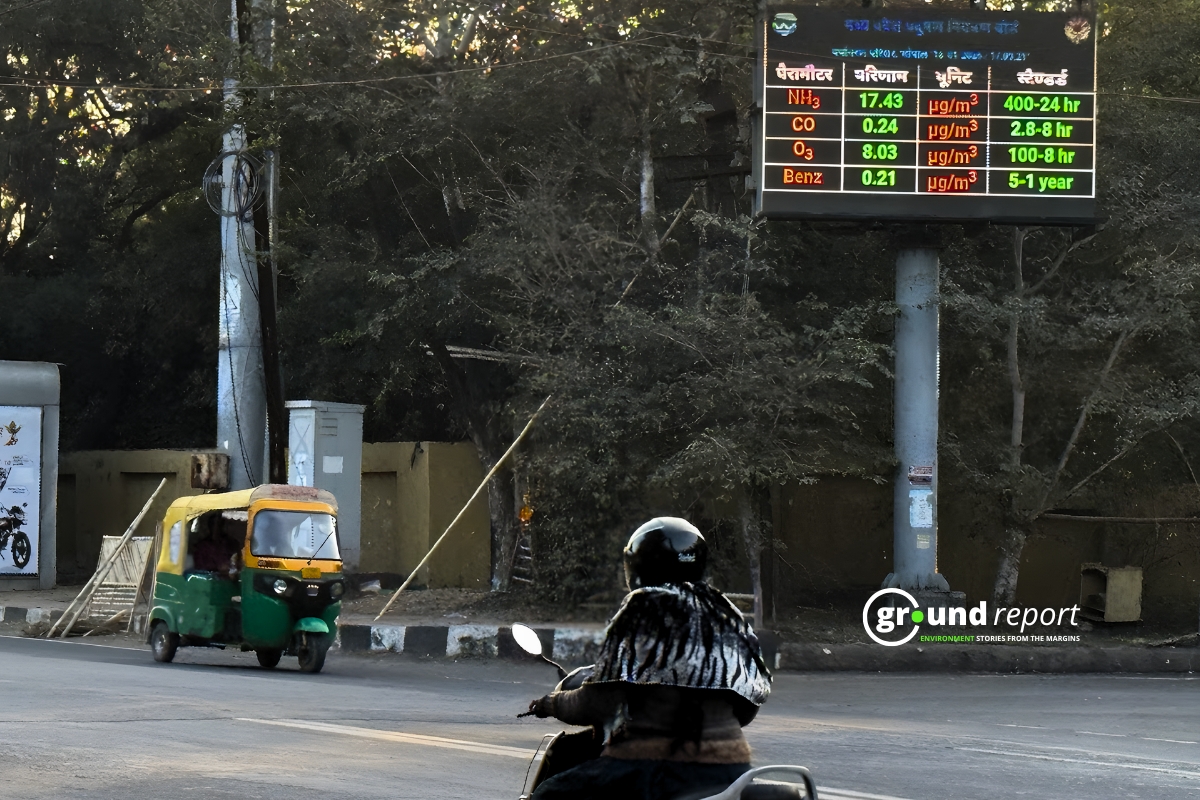
For decades, the lack of air pollution control stations has made it impossible to know data on local, national and global exposure to PM2.5 (the most harmful microparticles for environmental health).
Now, for the first time, a team of scientists led by Yuming Guo, from Monash University in Melbourne (Australia), has produced a map of the evolution of PM2.5 in the last two decades The results are published today in Lancet Planetary Health.
Study incorporated traditional and satellite observation
In conducting the study, the team used traditional air quality monitoring observations, satellite weather and air pollution detectors, and statistical and machine learning methods to accurately assess global PM2.5 concentrations.
Globally, the annual average PM2.5 from 2000 to 2019 was 32.8 µg/m3, according to the study.
- Despite a slight decrease in high PM2.5 exposed days globally, by 2019 more than 70% of days still had PM2.5 concentrations higher than 15 μg/m3.
- In southern Asia and eastern Asia, more than 90% of days had daily PM2.5 concentrations higher than 15 μg/m3.
- Australia and New Zealand had a marked increase in the number of days with high PM2.5 concentrations in 2019.
- Globally, the annual average PM2.5 from 2000 to 2019 was 32.8 µg/m3.
- The highest PM2.5 concentrations were distributed in the regions of Eastern Asia (50.0 µg/m3) and Southern Asia (37.2 µg/m3), followed by northern Africa (30.1 µg/m3).
- Australia and New Zealand (8.5 μg/m3), other regions in Oceania (12.6 μg/m3), and southern America (15.6 μg/m3) had the lowest annual PM2.5 concentrations.
- Based on the new 2021 WHO guideline limit, only 0.18% of the global land area and 0.001% of the global population were exposed to an annual exposure lower than this guideline limit (annual average of 5 μg/m3) in 2019.
These data, contrasted with the WHO guidelines for 2021, show that only 0.18% of the global land area and 0.001% of the global population were exposed to an annual exposure below this guideline limit (annual mean of 5 µg/m³) in 2019.
Seasonal patterns
The study also shows different seasonal patterns, such as lower pollution levels in northeast China and northern India during their winter months (December, January, and February), and higher PM2.5 levels in northeastern areas. of America during the summer months (June, July and August).
“We also recorded relatively high PM2.5 air pollution in South America in August and September and in sub-Saharan Africa from June to September,” Guo added.
For Guo, knowing these data is important because “they provide in-depth knowledge of the current state of outdoor air pollution and its impact on human health.”
“With this information, policymakers, public health officials, and researchers can better assess the short- and long-term effects of air pollution on health and develop strategies to mitigate it,” defends the researcher.
Keep Reading
- Air pollution may increase COVID severity: Study
- How much Air Pollution do cars really cause?
- Air pollution and fires, threats to clean water
- How decades of air pollution weakening our immune system?
- Air Pollution can amplify negative effects of climate change
- ‘Air pollution causing heart & respiratory diseases in West Bengal’
Follow Ground Report for Climate Change and Under-Reported issues in India. Connect with us on Facebook, Twitter, Koo App, Instagram, Whatsapp and YouTube. Write us on GReport2018@gmail.com.


